About The Cyclistic Bike-Share Case Study:
In 2016, Cyclistic launched a successful bike-share offering. Since then, the program has grown to a fleet of 5,824 bicycles that
are geotracked and locked into a network of 692 stations across Chicago. The bikes can be unlocked from one station and
returned to any other station in the system anytime.
Until now, Cyclistic’s marketing strategy relied on building general awareness and appealing to broad consumer segments.
One approach that helped make these things possible was the flexibility of its pricing plans: single-ride passes, full-day passes,
and annual memberships. Customers who purchase single-ride or full-day passes are referred to as casual riders. Customers
who purchase annual memberships are Cyclistic members.
Cyclistic’s finance analysts have concluded that annual members are much more profitable than casual riders. Although the pricing flexibility helps Cyclistic attract more customers, Lily Moreno, the Head of the Marketing Analysis Team, believes that maximizing the number of annual members will
be key to future growth.
I was tasked with answering the question: How do annual members and casual riders use Cyclistic bikes differently?
What the data shows
Note: You can access the Tableau Public dashboard that accompanies this presentation (view here)
Initial numbers:
The first thing I notcied when initially looking at the data for the time period of August 2021 to July 2022 was the total amount of rides. Cyclistic had 3,722,000 rides for the year. This broke down to 1,987,090 rides by members and 1,734,910 rides by casual riders.
Breakdown by Bike Type:
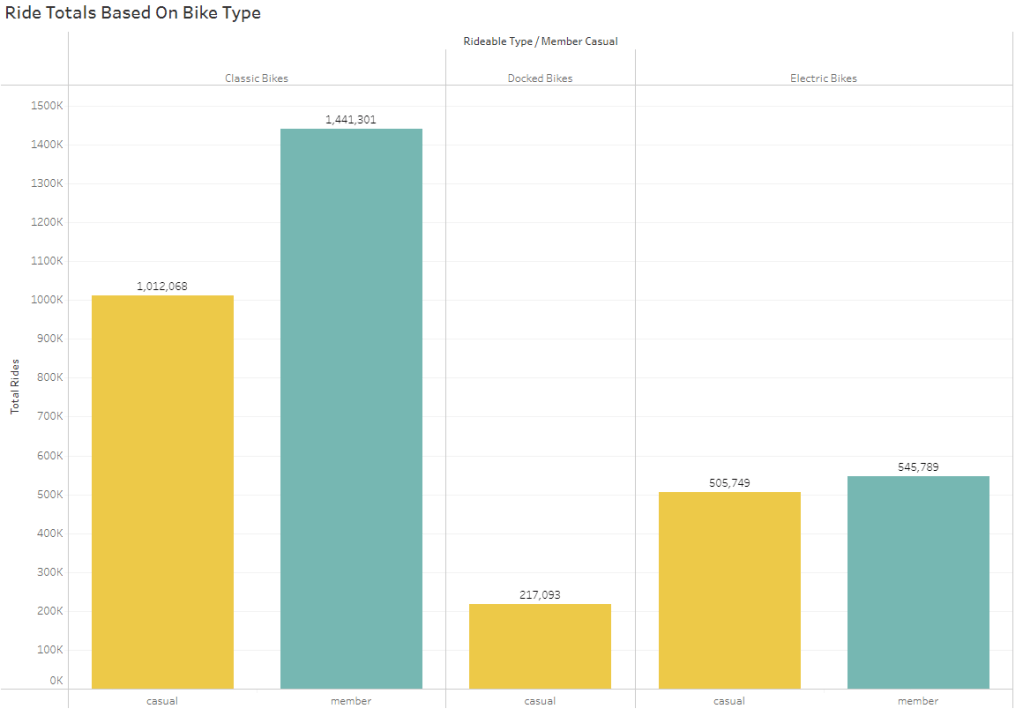
The first thing that stands out is that thru the whole year, only casual riders chose to ride docked bikes whereas members did not ride even once. This may imply that casual riders are more willing to use docked bikes.
When looking at the stations where docked bikes were, they werent isolated to a couple stations. They had a fairly broad spread throughout the Chicago area. Similar to the other two bike types. So, members most likey had a opportunity to use them.

But, looking at the amount of classic bikes used by members show that they much prefer classic bikes first followed by electric bikes second. Casual riders also preferred classic bikes but also enjoyed the electric bikes as much as the members. What this starts to reveal is that members may have a purpose behind their rides.
Total Rides Per Day Of The Week:

Here you really start to see a difference in members and casual riders. This also starts to show that members seem to use the bike-share services for a more utilitarian purpose. The first thing that you see is that throughout the week, members use the service a lot more consistantly that casual riders.
There is a consistancy with casual riders, but its primarily consistant during the weekends. What this starts to reveal is that casual riders are primarily using the services during their days off and vacations. And, this also starts to show that members may be using the service for commuting to work or posibly for exercise. This idea of exercise may also be why members tend to use classic bike over te electric and docked bikes.
Monthly Overall Ride Totals
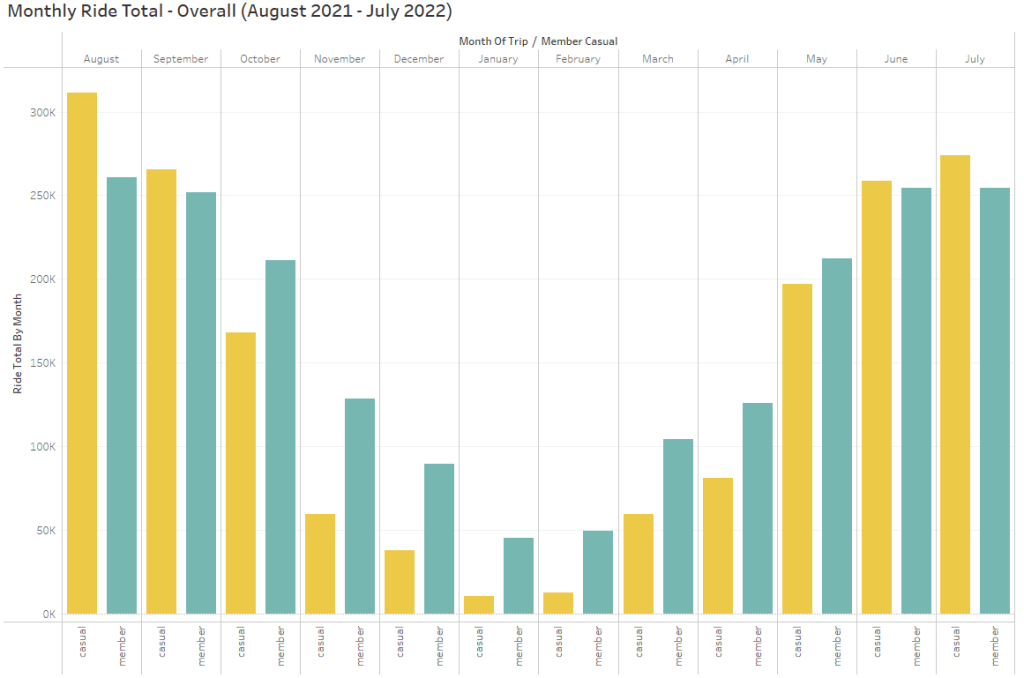
When we move on to the total of rides based on month you can see that casual riders are still following a pattern of use based on leisure. You can see the most popular months for casual riders are the warmers summer months. You can also see that casual rides drop off quite a bit when weather starts to turn colder. Members tend to follow the same trend but to a lesser degree. Their rides drop off but they still ride more than casual riders during winter months. Members still seem to continue to use the bike service for utilitarian purposes.
When we breakdown rides into ranges of ride length, you can start to see these ideas deeper even further.
Monthly Ride Totals: Rides Less Than 15 Mins
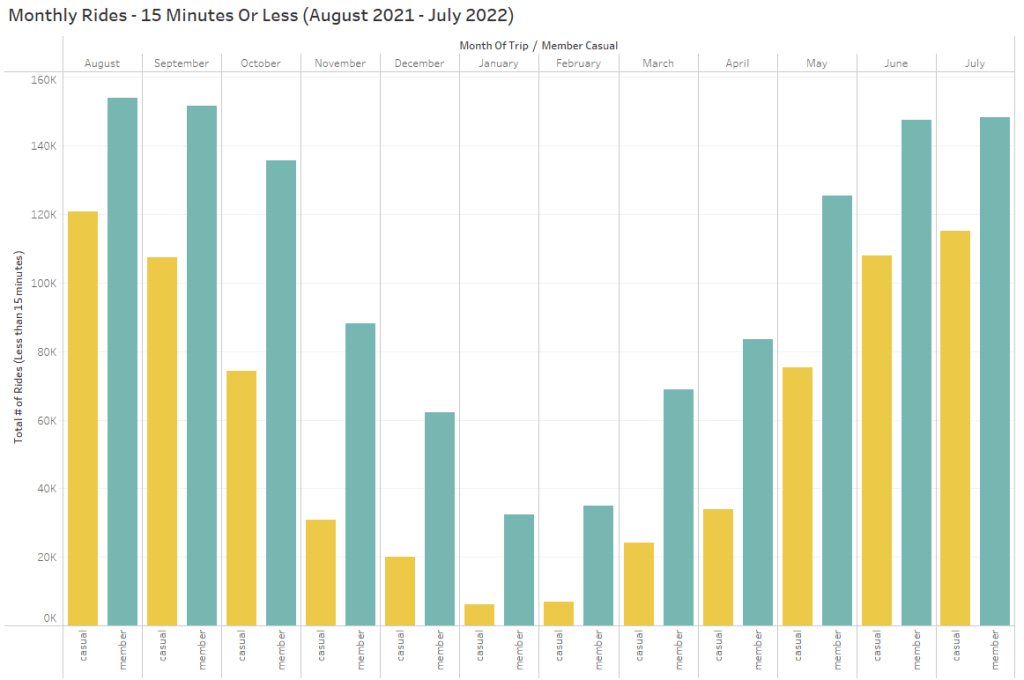
Here we see that members have rides less than 15 mins far more than casual riders. Which implies that members seem to be using the bike to be somewhere. Casual riders also have rides less than 15 minutes, but not to the extent members do.
Monthly Ride Totals: Between 15 – 30 Mins
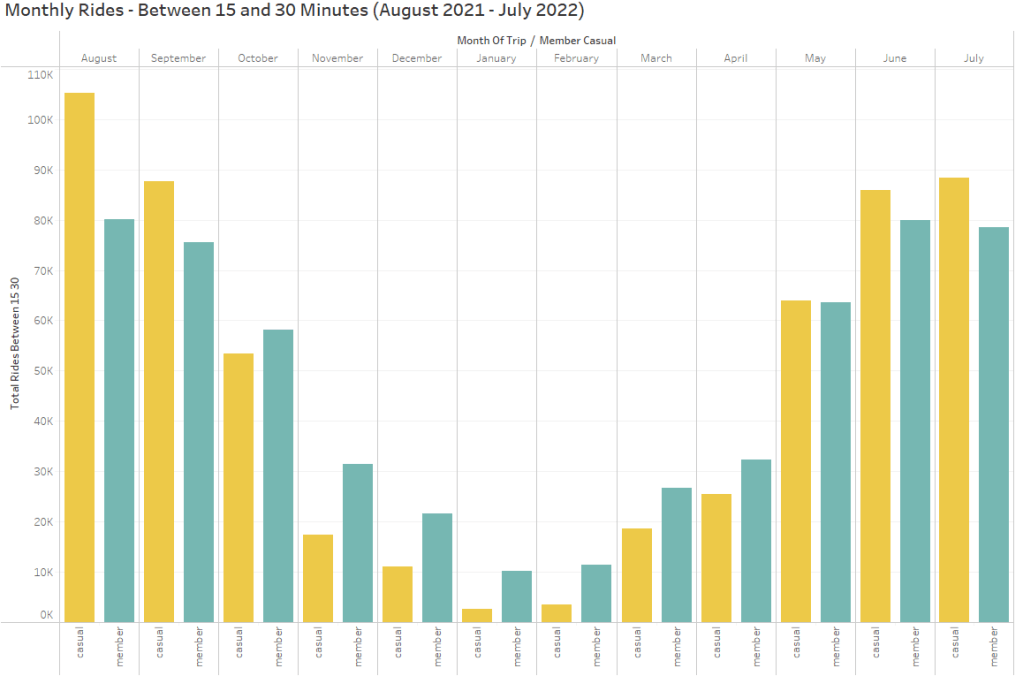
When it comes to rides between 15 and 30 minutes, we see a continuation of members using the bike services consistantly throughout the year. But we see that during the summer months, casual riders outpace members. This is where we start to see the casual riders trend of using the bikes more for leisure.
Monthly Ride Totals: Between 30 – 45 Mins
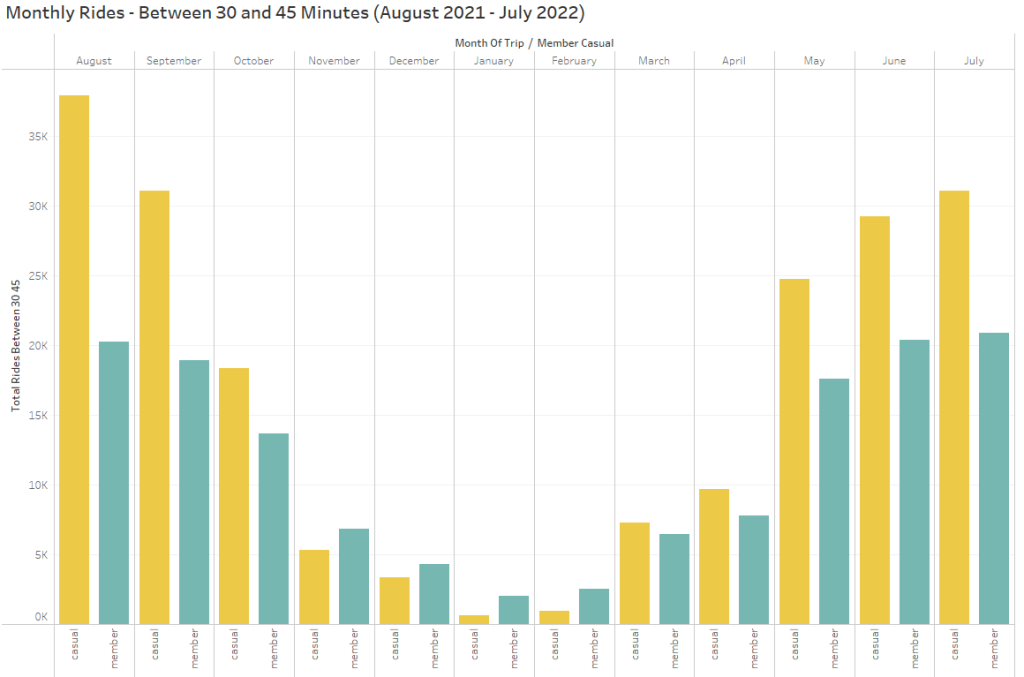
We now see that longer the ride the higher chance that its a casual rider. The member rides really start to drop off as a whole thoughout the year. They still top casual riders during the winter months, but the ride totals themselves are incredibly low. This tells me that members are still needing to use the service and will risk the cold. Again, meaning they have someplace to go.
Monthly Ride Totals: Between 45 – 60 Mins
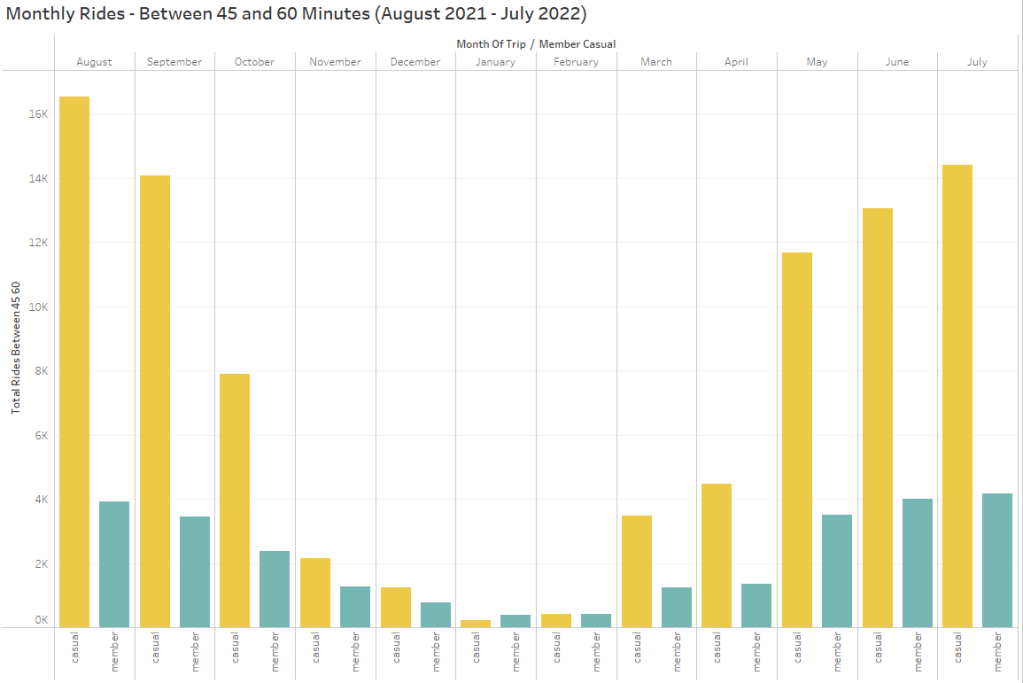
For rides between 45 and 60 minutes, you see that members ride totals drop of signifigantly. Which seems to imply that their rides rarely take longer then an hour. But, you can see that casual riders use the bike over 45 minutes a lot more than members. Again, this shows that casual riders are not worrying about getting to work on. The trend line for casual riders follow the other time periods. It absolutely clear that casual riders are using the bikes for fun.
Monthly Ride Totals: Over 60 Mins

This chart cements the idea that casual riders arent concerned with time during their rides. Members have incredily low ride totals that last ove an hour. What I did find interesting is that MANY of the rides over 60 minutes were actually quite longer. In many cases, rides actually lasted many hours. Given the information from other charts I believe that the members are actually keeping the bike through the whole day.
Top 20 Popular Stations:
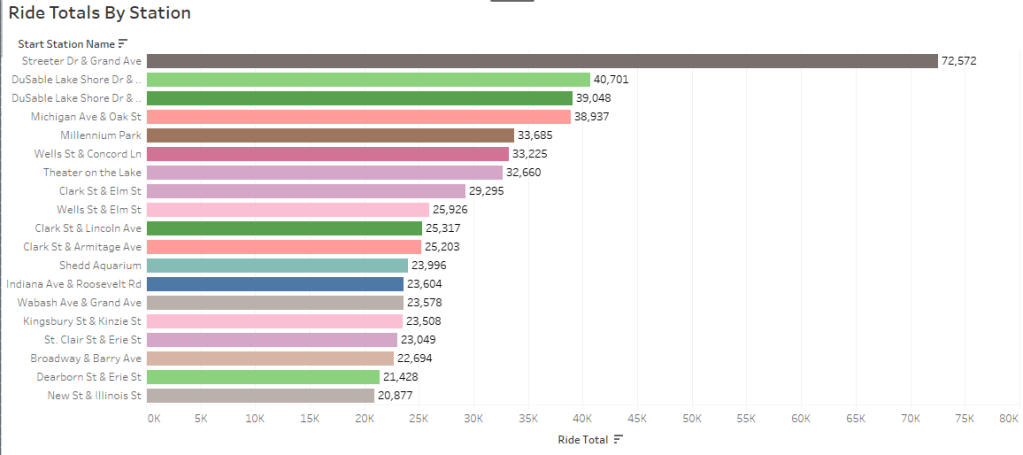
This chart shows the top 20 most popular stations. The most popular being Streeter Dr and Grand Ave. This station being located in the Magnificent Mile. This makes sense as this station just so happens to be in one of the most popular area in all of Chicago. The Magnificent Mile is home to many high end restaurants, stores, hotels, and many nationally recognized buildings. The rest of these stations are also located in the same area and moves up to the Gold Coast area.
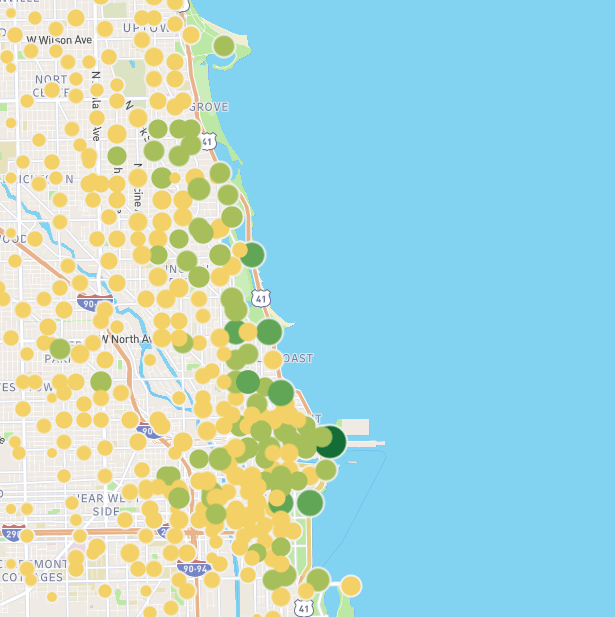
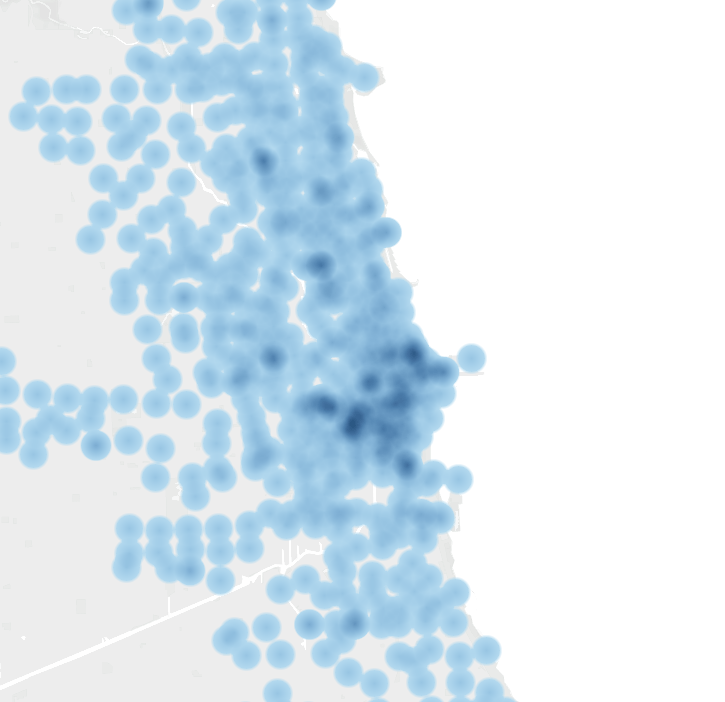
This map shows the most popular stations. Here you can see that the Magnificent Mile and the Gold Coast areas are the most popular and even reaches up to Uptown. These areas are prime locations and casual riders seem to stay in these areas.
This map shows casual riders using classic bikes. This map really shows where casual riders tend to stay when they use the our service.
These maps definitely illustrate that casual riders use their rides in the touristy locations of Chicago.
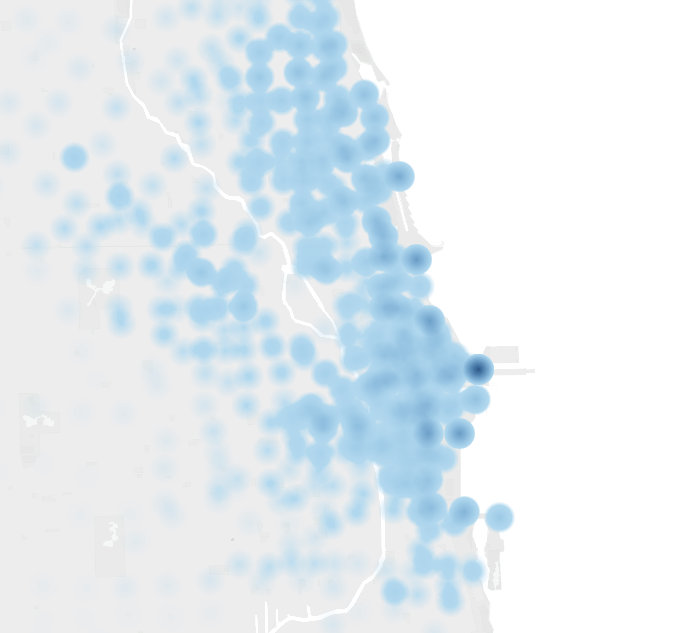
Now, when it comes to our members, they use these areas too. But the one thing that stood out was that members tend to use the services with more coverage. They dont just stay in the downtown area.

When you look at this map, you are looking at our members who ride classic bikes. You can see that a lot of rides do happen in the same area as casual riders. But, you can also see that our members have a lot more rides inland. They clearly have more coverage in neighborhoods.
These maps really brings into focus that members use the bikes more in what seems like a utilitarian fashion. Casual riders are more apt to use the bikes to visit the more tourist based areas of Chicago, which tells us that the casual riders are primarily tourist or vacationers in some fashion.
Conclusions:
We can definitely see there are some clear differences between casual riders and members. There are also som similarities.
We can see that members tend to use the bikes for some sort of purpose. This could be simply commuting into work. It could also mean members are using the bike service for exercise. I lean more toward the idea of commuting into work. This is due to the fact that the members tend to use the bikes more than casual riders throughout the whole week. We also see that members are more willing to use the service during colder times of the year. Casual riders seem to lean more toward the weekender/vacationer role. Again, looking at the use by day we can see that the bulk of rides happen on the weekend. The casual riders use the service on their days off. And, thoughout the year, they use the service during the summer months which lends more evidence to this line of thought.
When it comes similarities, both the members and casual riders use the service in the downtown area more than any other areas. The only difference is that members use the bikes more in outerlying neighborhoods. Another similarity is the time of year they use the bike service. They both seem to use the bikes more during warmer times of the year and less during colder times of year. The last similarity regard the types of bikes both use. Both seem to prefer classic bikes over electric bikes and docked bike. Though I will admit that it may just be that there are far more classic bikes than other types.
Recommendations:
So, given the data I have a couple recommendations.
- A Summer Pass. This would be a pass that would be advertised to casual riders during the summer months. This pass would be similar to the annual pass but only good for the summer. Near the end of summer we could then offer full year memberships at an introductory rate.
- Placement of advertising in the most popular tourist areas. Target Magnificent Mile and Gold Coast areas. I would also target advertising in these areas during the summer.
- A Text/Email/App campaign catering to casual riders. These communications alerting the casual rider of the benefits and savings they could recieve by starting a membership. Let the riders know that the service isnt just useful during their vacations. I would also cater the messages to their current ride count. Something along the lines of: “You have rider 10 times in the last month! Did you know that you could be saving X dollars by starting a membership!”
- Coupons for Members. These coupon could be offered to members as a way to incentivise the membership option. These coupon would only be offered to members. Prospective members would see that a membership offers them savings past just bike service. If these coupons were for locations in the downtown area (which we have seen is where casual riders use the service most), this may prompt them to purchase the year membership because they would be able to use them during their rides.
